Knowledge Basic Reporting
Knowledge Basic Reporting Provides ratings for using Serviceware Knowledge.
The Knowledge Basic Reporting offers a preconfigured selection of values, diagrams and tables that provide information on the use of the Knowledge system. The reports are structured according to the content types used in Knowledge and provide insights into the use and editing of content as well as consumer suggestions. The results of the evaluations can be filtered by time period and categories.
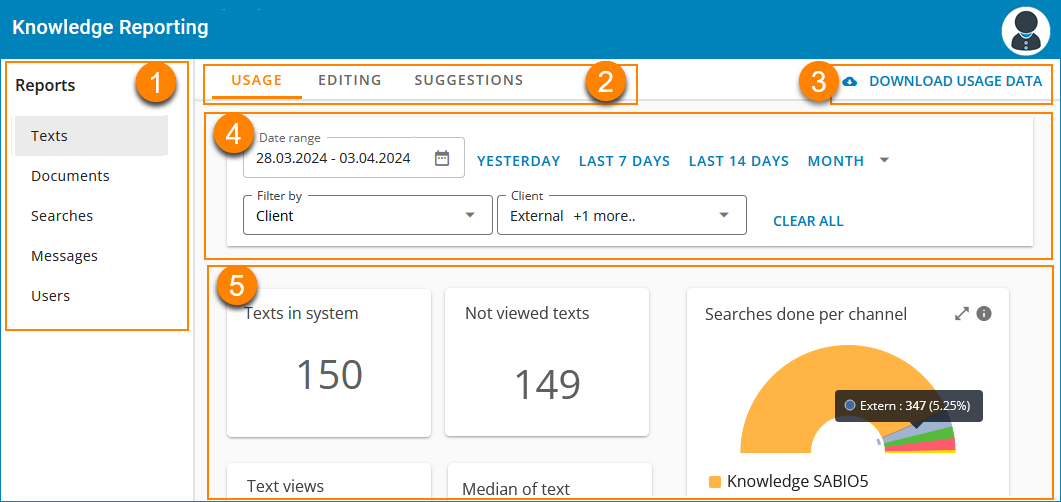
| (1) | Navigation menu for selecting an evaluated content type | (2) | Selection of the evaluated usage type within the document type |
| (3) | Option to download the usage data for the selected period as raw data | (4) | Filter option: Time period, selection of filter type and filter detail; deletion of filter type and filter detail |
| (3) | Filtered report content; the graphics can be selected for enlargement |
- Using, editing, and suggestions for texts
- Using and editing files
- Using the search
- Using and editing messages
- User behavior
The following types of usage can be rated for these document types:
- Usage
- Statistics on who uses something and how often.
- Editing
- Statistics on how often something was added or edited in the corresponding area.
- Suggestions
- Statistics on the status and number of suggestions for texts.
The detail view offers some functions to customize the display as well as to export the data.
- Data accessible via the user interface is stored for a period of 24 months.
- Raw data is stored for a period of 3 months.
Filter options
Filters are available to limit the results of Knowledge Basic Reporting.
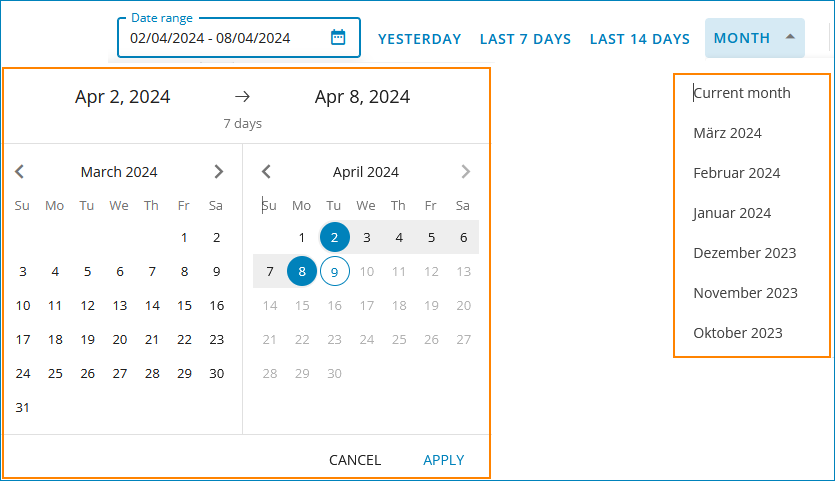
- Period
- Select the desired period using the calendar function or select one of the preset periods. The time by which texts are filtered is the date of the last edit. For messages, the creation date of the message is used as the filter date.
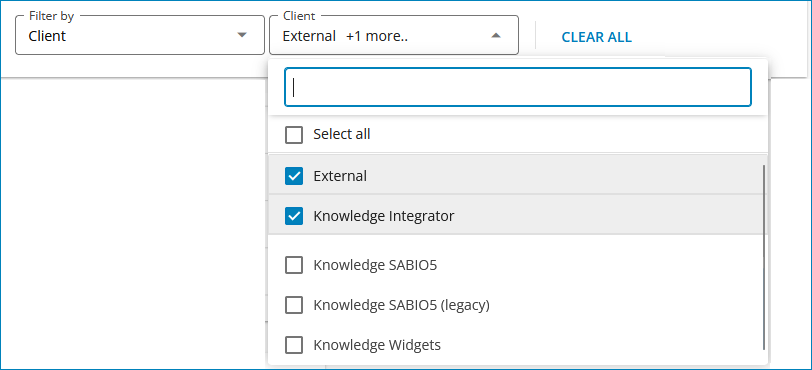
- Filter categories
- The analysis of usage data can be made clearer using filters.
-
Tables
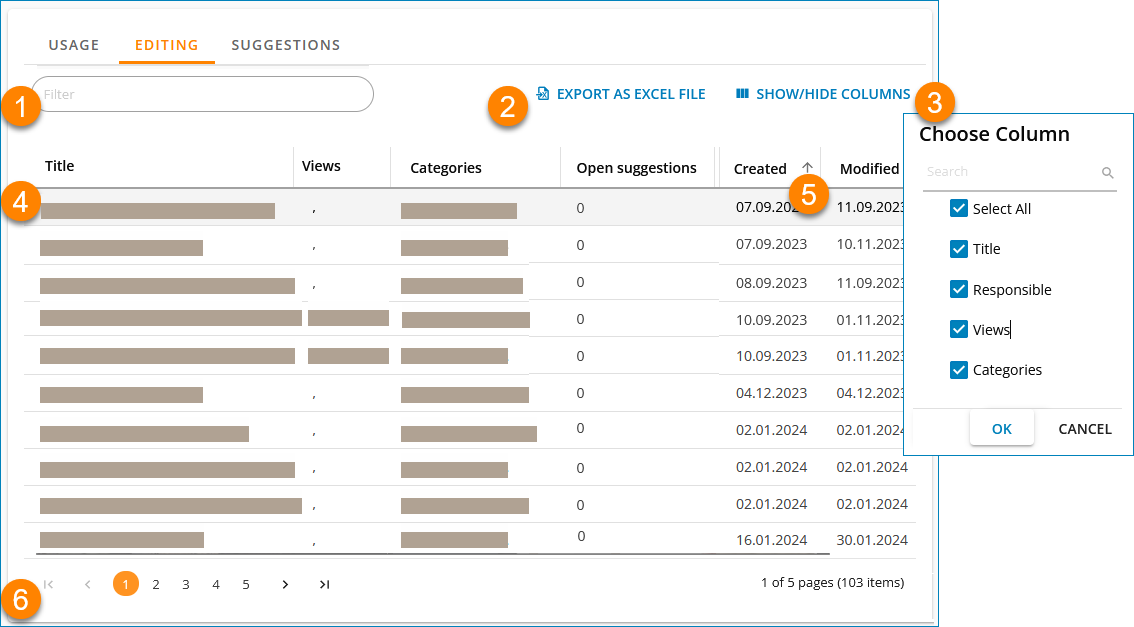
| (1) | Filter the results list according to search terms | (2) | Export function; export of the filtered results displayed in the table saved in an Excel list |
| (3) | Column configuration; selection of the table columns to be displayed | (4) | Display of the filtered results |
| (5) | Sort function; can be sorted in ascending or descending order according to the fields Rating, Created, Modified and Valid to | (6) | Search all entries |
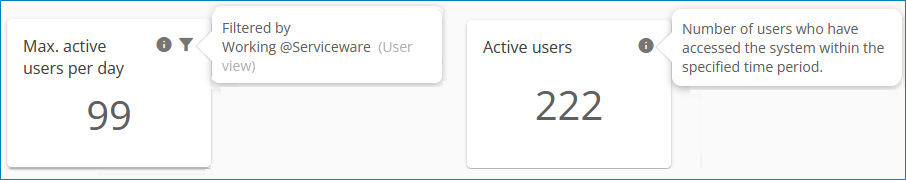
Cards with values
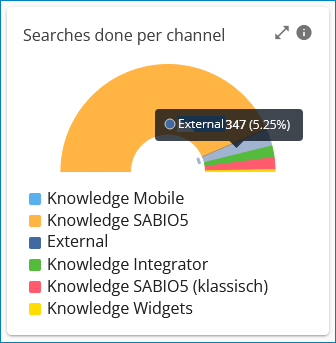
Diagrams
Statistics can be displayed in diagram form via Knowledge Basic Reporting. Column and ring diagrams are preconfigured.
- Ring diagrams
- The ring diagrams are overview diagrams. All results of the selected filter in the selected period are displayed there. Filter options are not taken into account in these diagrams.
- The corresponding values are displayed when you move the mouse over the individual fields of the diagram.
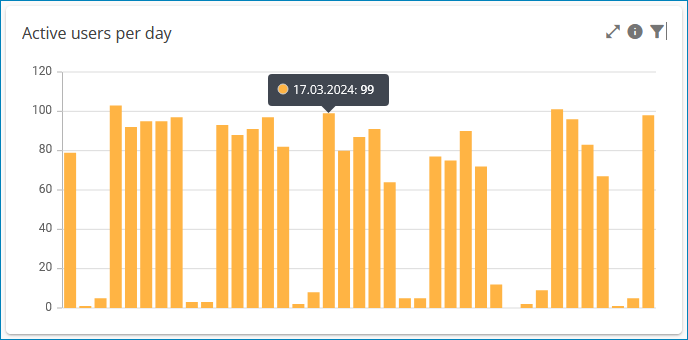
- Column charts
- Column charts each show a value in the form of a bar.
- Filtered values are indicated by a filter symbol in the top right-hand corner. The active filter settings are displayed when you move the mouse over the symbol.